Log-Log Graph Paper: uses, sizes and printing tips
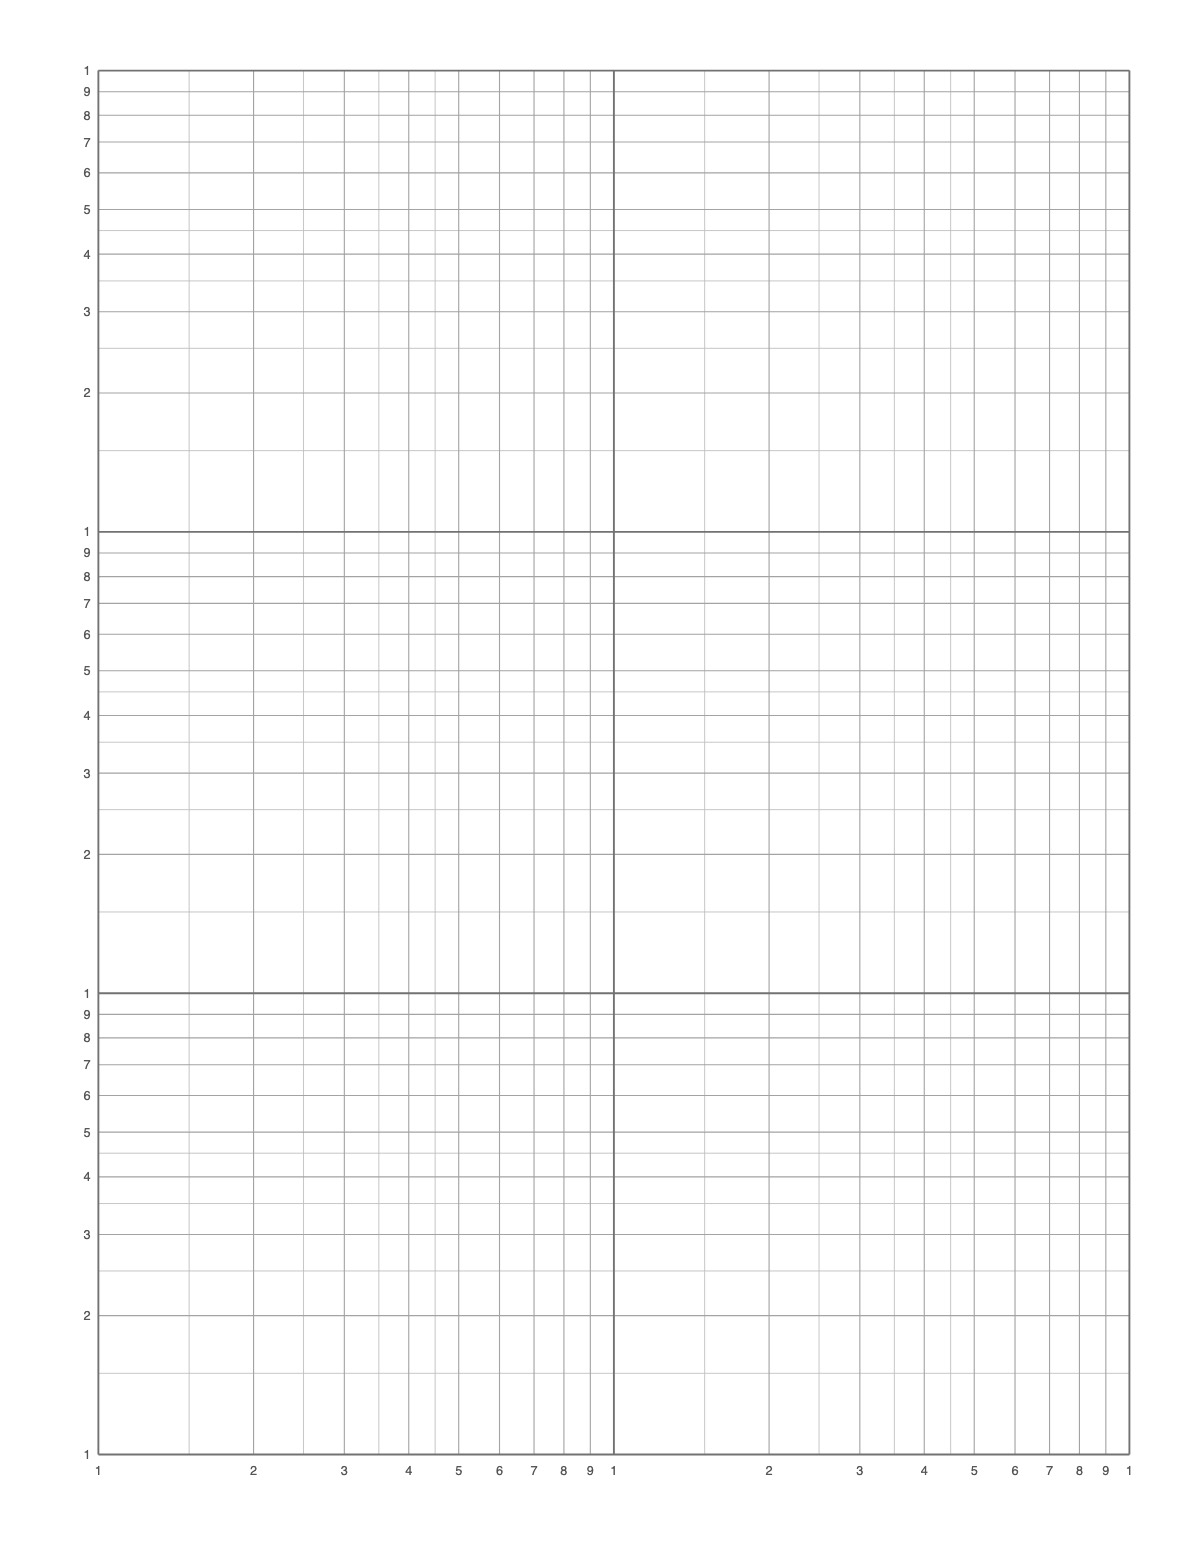
Log-log paper uses logarithmic scales on both axes, so data that follows a power law (y = a·xⁿ) plots as a straight line with slope n. Engineers and scientists use it for data spanning several orders of magnitude.
How to print it
- Choose the paper size (US Letter, A4, Legal, A5 or Half Letter) and portrait or landscape — the page updates as you change settings.
- Set how many log cycles the vertical and horizontal axes have; a linear axis makes it semi-log paper.
- Add a title or a name/date header if you want, or keep the page plain.
- Click Print / Save as PDF. In the print dialog choose “Actual size” (100%) and turn off “Headers and footers”.
Tips
- Make sure both axes use the same cycle length if you want to read slopes directly.
- Each cycle covers one power of ten (1–10, 10–100 …); write your own decade values next to the printed 1s.
- A straight line on semi-log paper means exponential growth or decay; on log-log paper it means a power law.
FAQ
How do I find the exponent from a log-log plot?
Measure the slope of the straight line with a ruler in the same units on both axes — rise over run equals the exponent n.
Can I change the number of cycles?
Yes, 1–5 cycles vertically and 1–4 horizontally.
How many cycles do I need?
Count the powers of ten in your data. Values from 2 to 900 span 1–10, 10–100 and 100–1000, so you need 3 cycles.
Is it free, and do I need an account?
It is completely free with no sign-up and no download. Change the settings, print it or save it as a PDF, and bookmark the address — your settings are stored in the link.
Related paper


More Math Graph Paper: Coordinate Plane · Coordinate Plane – 4 per Page · Coordinate Plane – 6 per Page · First Quadrant Graph Paper · Blank Coordinate Plane · Polar Graph Paper
↑ Customize and print the Log-Log Graph Paper